Beginner’s Guide to 3D-QSAR in Drug Design
Learn the basics of 3D-QSAR in drug design with this beginner-friendly guide.
12 min read
May 29th, 2025
Last updated: May 29th, 2025


Introduction
We utilize quantitative structure-activity relationship (QSAR) modeling to correlate the chemical structure of compounds with their biological activity. Simply put, QSAR offers us a predictive framework to estimate how active a molecule might be, based on its molecular characteristics and features. If you're new to QSAR, we recommend giving this blog a quick read to get familiar with the basics.
Traditional 2D-QSAR methods often use numeric descriptors of molecules to build statistical models linking structure to activity. These models help researchers understand which chemical features increase or decrease biological effects, guiding the design of better compounds. Three-dimensional QSAR (3D-QSAR) is an extension of this idea, bringing the molecule’s three-dimensional shape and interaction potentials into the picture.
While classical QSAR might treat a molecule as a flat or feature list, 3D-QSAR considers the molecule as a 3D object with a shape and fields (regions of positive/negative charge, steric bulk, etc.) around it.
In this post, we’ll walk you through the core concepts of 3D-QSAR, how it builds on traditional QSAR approaches, and why it has become indispensable in modern drug discovery. We’ll also share practical applications, discuss the types of data inputs required, and highlight some of the key software tools we rely on to perform these analyses effectively.
What is 3D-QSAR?
In classical QSAR, we describe molecules using summary descriptors such as logP for hydrophobicity or counts of specific atom types. These are one-dimensional or two-dimensional descriptors that do not depend on the molecule’s three-dimensional orientation. We can rotate or translate the molecule in space without altering these values, as they are invariant to conformation. In contrast, in 3D-QSAR, we derive descriptors directly from the spatial structure of the molecule.
To build a solid foundation in QSAR, explore the must-read papers on building QSAR models.
A 3D-QSAR model typically quantifies steric fields, which represent regions where the molecular bulk may clash or accommodate other structures, and electrostatic fields, which map areas of positive or negative potential. To extract these descriptors, we align each molecule within a coordinate grid and compute the field values at specific points surrounding it. This approach leads to a much higher dimensional descriptor space than in classical QSAR.
Instead of relying on a compact set of global features, we represent each molecule with detailed field values measured at many locations in space. This provides finer resolution of molecular interactions but also introduces challenges related to molecular alignment, data dimensionality, and model regularization.
How to Build a 3D-QSAR Model
Data collection
To set up a 3D-QSAR study, we start by assembling a dataset of compounds with experimentally determined biological activities, such as IC50 or EC50 values. The integrity of this dataset is paramount. We select molecules that are structurally related to ensure coherent modeling, yet sufficiently diverse to capture meaningful structure-activity relationships.
All activity data must be acquired under uniform experimental conditions. Any variability in assay protocols introduces unwanted noise and systemic bias into the resulting QSAR model, thereby compromising its predictive value.
Molecular modeling
With the dataset defined, we generate 3D molecular structures by converting 2D representations into three-dimensional coordinates using cheminformatics tools like RDKit or Sybyl. These initial 3D structures are then geometry-optimized using molecular mechanics such as the universal force field (UFF) or, for higher accuracy, quantum mechanical methods.
Optimization ensures that each molecule adopts a realistic, low-energy conformation. Since the selected conformation critically influences alignment and descriptor calculation, we prioritize structural accuracy at this stage.
Molecular alignment
Molecular alignment constitutes one of the most critical and technically demanding steps in 3D-QSAR. Our objective is to superimpose all molecules within a shared 3D reference frame that reflects their putative bioactive conformations.
Imagine trying to compare two keys by their shape. You’d align them in a way that fits into the same lock. Similarly, in 3D-QSAR, we must choose a bioactive conformation (an arrangement of its atoms believed to correspond to how it binds the protein) for each molecule, and then align all molecules to a common orientation (often guided by a known active molecule or common substructure).
This alignment assumes that all compounds share a similar binding mode. It can be done manually or with algorithms, such as Bemis-Murcko, which derives scaffolds by removing side chains, or maximum common substructure (MCS), which identifies the largest shared substructure.
A poor alignment undermines the entire modeling process by introducing inconsistencies in descriptor calculations, which is why some modern methods aim to bypass alignment altogether. Nonetheless, traditional approaches such as Comparative Molecular Field Analysis (CoMFA) remain alignment-dependent.
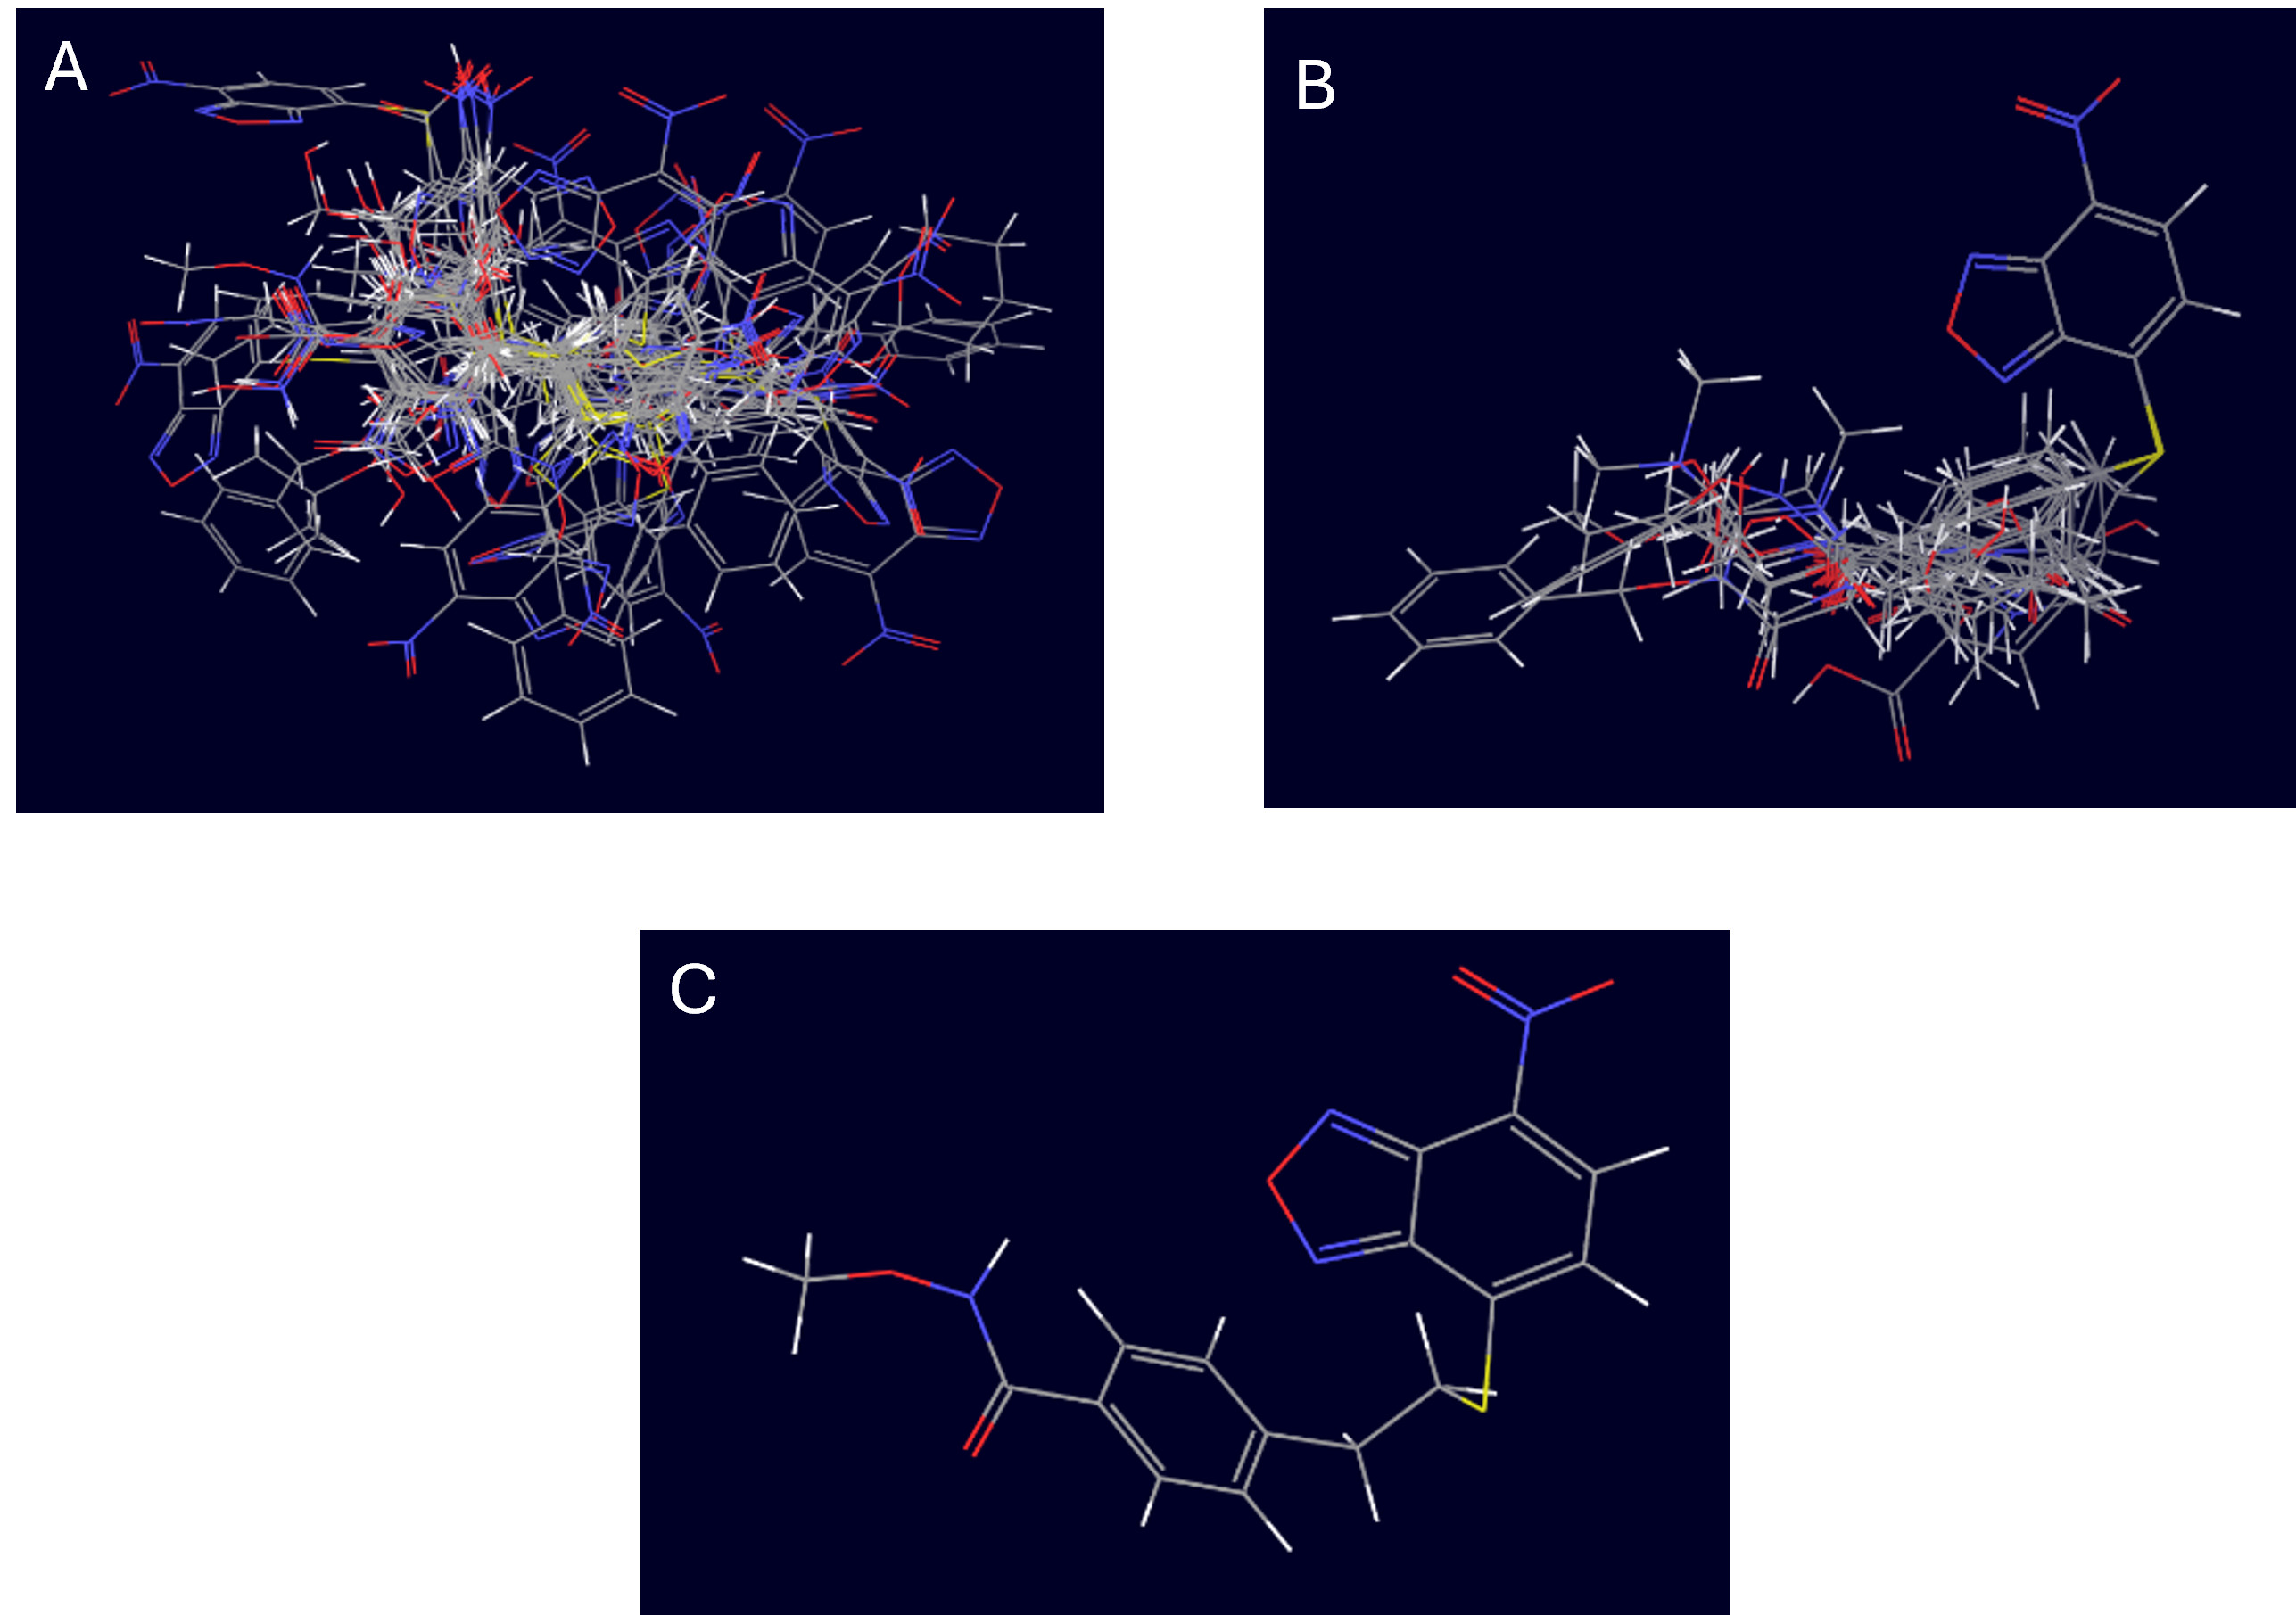
Figure 1. Visualization of molecular alignment workflow for 3D-QSAR modeling. A) Superposition of all molecules in the dataset, showing the diversity and distribution of the compound conformations before alignment. B) Aligned molecules after 3D alignment, highlighting the common scaffold and orientation used for 3D-QSAR modeling. C) Reference molecule or template used for alignment, showing the core structure and orientation for the alignment process.
Table
| Bemis-Murcko Scaffold | Maximum Common Substrate |
|---|---|
| Defines a core structure by removing all side chains and retaining only the ring systems and linkers. Widely used for clustering and scaffold-based analysis. | Identifies the largest substructure shared among a set of molecules, even if the scaffolds are not clearly defined. Useful for comparing diverse chemotypes. |
| Alignment is achieved by superimposing compounds on the shared scaffold, leading to a consistent orientation across molecules. | Alignment is based on the most significant common features, allowing for meaningful comparison even when structural variation exists. This can improve the quality of 3D-QSAR models. |
| Tools like RDKit’s AllChem.ConstrainedEmbed() can generate 3D conformations that match scaffold atoms to a reference, ensuring accurate alignment. | MCS-based alignment can also be automated using cheminformatics tools, facilitating the generation of comparable 3D conformations for diverse datasets. |
Molecular descriptors
Following alignment, we compute 3D molecular descriptors that numerically represent the steric and electrostatic environments of each molecule.
A classic method, CoMFA, uses a lattice of grid points surrounding the molecules. At each point, a probe atom is used to measure interaction energies with the molecule: typically steric (van der Waals) and electrostatic interaction energies are calculated at each grid point.
In plain language, we are mapping out how a tiny test probe “feels” the presence of the molecule at various locations around it. Is it bumping into a bulky group? Is it feeling an attractive positive charge?
The collection of all those field values forms a fingerprint-like descriptor for the molecule’s 3D shape and electrostatic profile.
Comparative Molecular Similarity Indices Analysis (CoMSIA) extends this approach by using Gaussian-type functions to evaluate steric, electrostatic, hydrophobic, and hydrogen-bonding fields, which smooth out abrupt field changes and enhance interpretability, especially across structurally diverse compounds.
CoMFA is highly sensitive to alignment quality, making it crucial to achieve precise spatial congruence across molecules. CoMSIA, on the other hand, offers more tolerance to minor misalignments, thereby expanding its applicability in datasets with broader chemical diversity.
| CoMFA | CoMSIA |
|---|---|
| Calculates steric (Lennard-Jones) and electrostatic (Coulomb) fields on a 3D grid around aligned molecules. | Uses Gaussian-type similarity functions to compute steric, electrostatic, hydrophobic, and hydrogen bond donor/acceptor fields. |
| Field values are determined using a probe atom (typically a carbon with +1 charge) at each grid point. | Captures a wider range of molecular interactions, providing more detailed insights into structure-activity relationships. |
| Highly sensitive to molecular alignment, so precise alignment is crucial for reliable models. | More robust to small changes in alignment, making it suitable for structurally diverse datasets. |
Model building
With descriptors in hand for a series of molecules (along with their known activities, e.g. an IC50 or binding affinity for each compound), the next step is to find a mathematical relationship that links the 3D descriptor values to biological activity. Usually, we use statistical regression techniques like partial least squares (PLS) regression in CoMFA and many 3D-QSAR studies. PLS can handle the large number of highly correlated descriptors by projecting them to a smaller set of latent variables.
The outcome is a mathematical model capable of predicting biological activity from 3D field data. We visualize this model using contour maps that identify spatial regions where specific molecular features enhance or diminish activity. These visualizations are one of the most useful outputs of 3D-QSAR for chemists.
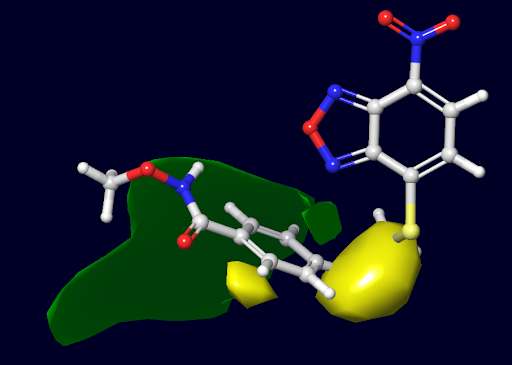
Figure 2. An example of a 3D QSAR steric contour map for a molecule. Green and yellow contour regions indicate where adding bulky groups increases or decreases activity, respectively. In practice, such a map is overlaid on a reference molecule (shown in stick form) to guide modifications: a green contour suggests “more bulk here could be beneficial,” whereas a yellow contour warns “bulk here would likely hurt activity.” The visual analysis of a steric contour map is straightforward. We can recognize the favorable (green) or unfavorable (yellow) regions and imagine what analogs might be more potent or less potent based on these hints.
In the Figure 2 above, for instance, the green blob near one part of the molecule suggests that enlarging a substituent in that region could increase binding (perhaps by filling a hydrophobic pocket in the protein), while the yellow blob indicates a region where the molecule is as large as it can be. Any bigger group there would clash with the target and reduce activity. These contour maps translate the raw data of a 3D-QSAR model into an intuitive ‘activity atlas’ for medicinal chemists.
Model validation
Once the 3D-QSAR model is built, it’s essential to test how well it can predict activity for new, unseen compounds. We employ cross-validation techniques, such as leave-one-out (LOO), where each compound is sequentially excluded from the training set and predicted by a model built from the remaining data. Alternatively, we may reserve an external test set to evaluate generalizability.
We quantify model performance using statistical metrics: Q² for cross-validated predictivity and R² for goodness-of-fit. A robust model should exhibit high values for both metrics, which means that it will capture meaningful biological trends without overfitting.
Model interpretation
After validation, we analyze the contour maps to interpret how molecular features influence biological activity. These spatial insights enable us to rationalize observed activity trends and make targeted design decisions.
For example, steric contour maps (Fig 2) show where adding bulk (green) is favourable or where it should be avoided (yellow), while electrostatic maps indicate regions that benefit from electronegative (red) or electropositive (blue) groups. These visual cues help guide rational chemical modifications.
Design and synthesis
Using insights from the contour maps, we design new analogs by modifying regions flagged by the model as favorable for activity enhancement. These newly designed compounds are then synthesized in the lab and biologically tested. The experimental results either confirm or challenge the model’s predictions, providing a feedback loop for refinement.
Iteration
3D-QSAR is inherently iterative.
We incorporate activity data from newly synthesized compounds into the training set, re-optimize the alignment if necessary, and retrain the model. Each cycle increases the robustness and predictive power of the model, gradually guiding us toward the identification of optimal bioactive compounds.
Check out this blog to refresh your QSAR basics!
Applications of 3D-QSAR in Drug Design
Why is 3D-QSAR important in modern drug discovery, and how is it actually used? 3D-QSAR plays a central role in ligand-based drug discovery, where we design compounds by analyzing known active ligands rather than relying on a resolved 3D structure of the target protein. The sections below outline the key ways 3D-QSAR is applied and why it remains an essential tool in modern medicinal chemistry.
Refining drug candidates (Lead optimization)
One of the most common uses of 3D-QSAR is in optimizing a series of lead compounds. If we have, say, 20 analogues of a molecule with measured activities, a 3D-QSAR model can help decipher which parts of the molecule are contributing to stronger or weaker activity. This guides us on what chemical modifications to try next. CoMFA studies have been used to prioritize synthesis of new analogs by identifying regions where a substituent could enhance bindings.
In practice, medicinal chemists overlay the 3D-QSAR contour maps on their molecules and design new derivatives that exploit the “green” favorable regions and avoid the “yellow” unfavourable ones. This approach has been pivotal in optimizing many drug classes. For instance, traditional 3D-QSAR methods (like CoMFA and CoMSIA) were instrumental in improving the potency of various kinase inhibitors during lead optimization. Identifying critical molecular regions for activity allows chemists to focus modifications, enhancing potency or selectivity.
When the protein structure is not available
3D-QSAR shines in scenarios where you don’t have an X-ray crystal structure of the drug target. In modern drug discovery, if the 3D structure of the target protein is available, researchers might use structure-based methods (like molecular docking and molecular dynamics).
But often, especially in the early stages or for novel targets, you might only have a bunch of active compounds and no 3D structure of the receptor. 3D-QSAR is ideal here. It helps infer the shape and electrostatic requirements for activity based purely on the ligand data.
Essentially, it builds a rudimentary model of the “phantom receptor” through the common patterns in the ligands. This was how many drugs were designed in the pre-structural biology era, and it’s still valuable for orphan targets or when you want a quicker ligand-based approach.
Understanding structure-activity relationships
In addition to making predictions, 3D-QSAR deepens our understanding of structure–activity relationships. The process of building a 3D-QSAR model forces you to think about alignment (i.e., hypothesizing how the compounds bind). It also yields visual maps that rationalize why some compounds are more potent. These insights deepen understanding of the SAR.
For instance, if highly active molecules consistently present a positively charged group in a defined spatial region, we can infer that this feature aligns with a negatively charged pocket on the target protein. These insights complement pharmacophore modeling and other interpretive techniques by clarifying which interactions are critical to potency.
Virtual screening and prediction
Once validated, a 3D-QSAR model becomes a tool for virtual screening. We can evaluate compounds virtually by computing their field-based descriptors and using the model to predict activity. For example, if you have a 3D-QSAR model for an enzyme inhibitor, you could virtually ‘score’ new compounds (by computing their field descriptors and plugging into the model) to see which are predicted to be most potent. This supports compound prioritization prior to synthesis, saving both time and resources.
An additional application is off-target effect prediction. For instance, 3D-QSAR models developed for hERG channel blockers (which cause cardiac side effects) were used as a virtual screening tool to flag cardiotoxicity risk in novel compounds.
While newer machine learning approaches continue to gain popularity, 3D-QSAR’s strength is that it is quite interpretable and is grounded in chemical intuition (shapes and charges), making it a trusted method for many medicinal chemists.
We often use 3D-QSAR alongside other computational methods. For instance, we could use molecular docking to suggest an alignment or conformation for 3D-QSAR modelling or use 3D-QSAR results to refine a pharmacophore model.
In modern workflows, 3D-QSAR is also combined with machine learning algorithms (like neural networks) to improve predictive power. Advanced models can use 3D field-based descriptors as input features highlighting how 3D-QSAR continues to evolve and drive modern drug design.
Software Tools for 3D-QSAR
In conducting 3D-QSAR studies, we have access to a diverse array of software platforms, ranging from legacy systems that shaped the field to modern, customizable open-source tools. Each of these solutions offers distinct capabilities, and selecting the right one depends on our modeling objectives, infrastructure, and preference for control versus convenience. Let’s take a look at some of the popular tools.
SYBYL (Tripos)
We often turn to SYBYL when working with Comparative Molecular Field Analysis (CoMFA). As the original platform for this approach, it features tools for alignment, field computation, PLS regression, and visualization. SYBYL has long served as the industry standard for traditional 3D-QSAR.
MOE (Molecular operating environment)
MOE provides us with an integrated environment for everything from conformer generation and alignment to QSAR modeling and receptor-based design. Its strength lies in streamlining diverse modeling tasks under one framework, making it especially valuable when we require tight coupling between structure- and ligand-based approaches.
Schrödinger’s Suite (Phase/QSAR)
The Schrödinger suite offers high-precision tools for pharmacophore-based alignment and 3D-QSAR development. With extensive statistical validation options, it excels when we are building models that demand both rigor and interpretability. These are well suited to integrated structure- and ligand-based workflows.
LigandScout
For pharmacophore-centric modeling, we frequently use LigandScout. It supports 3D-QSAR modeling based on pharmacophore-aligned ligands. Its visual outputs are useful for distinguishing active from inactive molecules.
Open3DQSAR
Open3DQSAR provides an implementation of CoMFA/CoMSIA-like modeling that is free to use, which is great for students and researchers who may not have access to expensive commercial software. It allows us to perform the whole workflow from alignment to PLS modelling and visualize contour maps. The open nature means you can see and tweak the details of the analysis, which is excellent for learning and method development.
Web Platforms and Custom Tools
There are many web-based tools and programming libraries for QSAR. For instance, the website 3D-QSAR.com provides an online platform to build 3D-QSAR models via a simple interface (useful for educational purposes or quick tests). Many researchers also use programming libraries (like RDKit in Python) to calculate 3D descriptors and then apply machine learning libraries (scikit-learn, etc.) to develop QSAR models.
Python has become a popular “do-it-yourself” approach for QSAR modelling, allowing full control and customization.
This means if you have coding skills, you can script your own 3D-QSAR workflow: align molecules (perhaps using an algorithm or an external tool), compute 3D grid descriptors or other 3D features, and feed them into an ML model of choice. This approach is powerful especially when integrating 3D-QSAR with novel machine learning techniques or when trying out new types of descriptors.
Choosing the Right 3D-QSAR Tool
Each tool has its learning curve and advantages. For beginners, graphical tools like MOE or Discovery Studio (another suite by Biovia that includes 3D-QSAR capabilities) can be easier to start with, whereas open3DQSAR or custom Python-based workflows might appeal to those who want more control or cannot access commercial tools.
Regardless of the tool, the underlying principles remain the same. So, learning the core concepts of 3D-QSAR will allow you to use any software effectively.
Conclusion
3D-QSAR is a fascinating blend of chemistry and computation. It takes the old idea that “structure determines activity” and adds a three-dimensional twist to it. By capturing spatial and electrostatic features, 3D-QSAR models offer a richer perspective than traditional 2D QSAR approaches.
Over the years, 3D-QSAR has been used in countless lead optimization projects. It allows researchers to build predictive models even without a protein structure, and to visualize hypotheses about what makes a molecule active. The method is adaptable to modern pipelines and continues to evolve through integration with machine learning and alignment-independent strategies.
For those of you who are new to computational drug design, learning 3D-QSAR offers a strong introduction to how chemists think in three dimensions and how we translate structural features into actionable models. In practical terms, 3D-QSAR is like drawing a spatial activity map, helping us identify exactly where and how to modify a molecule to improve its performance.
Whether used independently or as part of a larger modeling strategy, 3D-QSAR remains a powerful approach for designing more effective, selective, and safe drug candidates.
Dreaming of a career at Pfizer, Novartis, or Roche?
Accelerate your path into biopharma. Master cheminformatics with our certified course!
- Gain expertise in molecular fingerprints, clustering & QSAR modeling
- Learn to curate & analyze massive chemical datasets like a pro
- Develop in-demand skills for cheminformatics roles in leading biotech firms